> ## Documentation Index
> Fetch the complete documentation index at: https://support.pexcard.com/llms.txt
> Use this file to discover all available pages before exploring further.
# Dashboard analytics: understanding your business at a glance
> Visual insights into your spending, payments, team composition and card declines — right from your PEX Dashboard
Dashboard analytics transforms your PEX Dashboard into a visual command center. Instead of raw numbers alone, you get interactive charts and summary widgets that help you spot trends, identify issues and make better financial decisions — all without leaving the Dashboard.
You'll see analytics widgets throughout the Dashboard, the Cards page, the Transactions page and the Team Members page.
## Dashboard widgets
When you log in as an administrator, the main Dashboard page displays the following analytics sections:
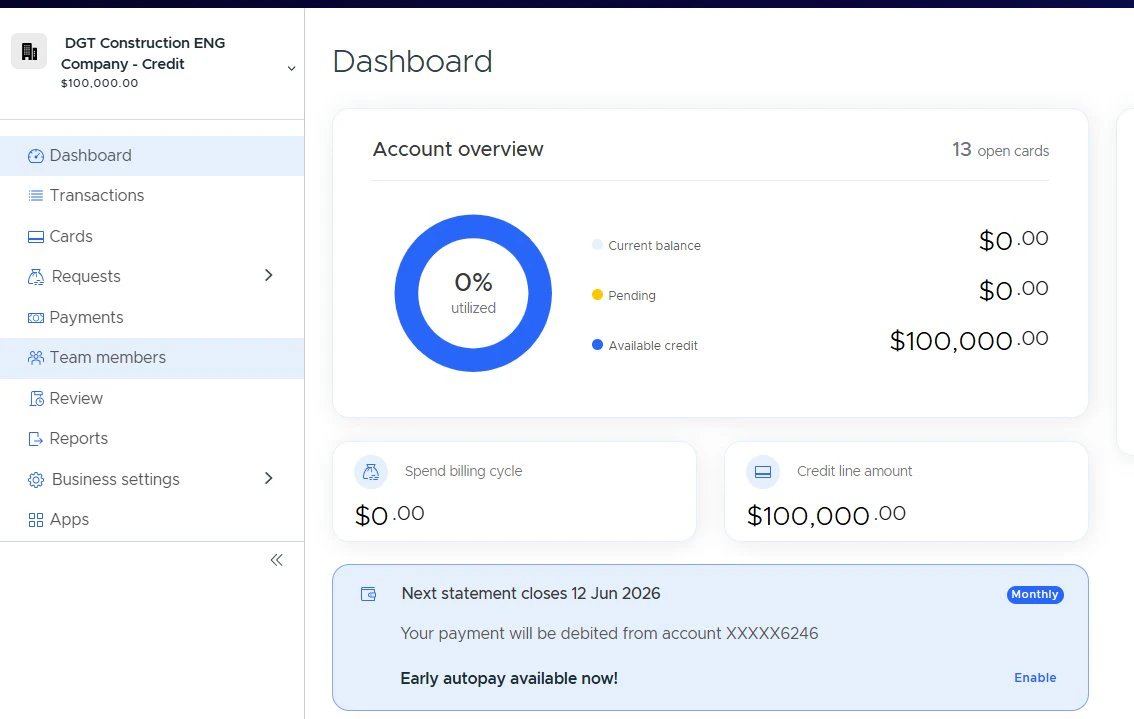
### 1. Account overview
The account overview widget shows **credit utilization** — the percentage of your credit line currently used — with a legend showing **Current Balance**, **Pending Transactions** and **Available Credit**. The header shows the total number of **open cards**.
 ### 2. Metric tiles
Below the account overview, quick-glance metric tiles summarize key financial data points:
| Metric tile | Description |
| ------------------------------------- | ----------------------------------------------------------------------------------------------------------- |
| **Pending card transactions** | Total dollar amount of transactions that haven't settled yet |
| **Pending ACH transfers** | Total dollar amount of bank transfers currently in progress |
| **Total ledger balance at 12am (ET)** | Your account's ledger balance as of midnight Eastern Time |
| **Card spend since 12am (ET)** | How much has been spent on cards since the start of the day |
| **Spend billing cycle** | Total spend in the current billing cycle (Credit programs) |
| **Credit line amount** | Your total credit line (Credit programs). Includes an action to request a credit limit increase if eligible |
### 3. Monthly spend
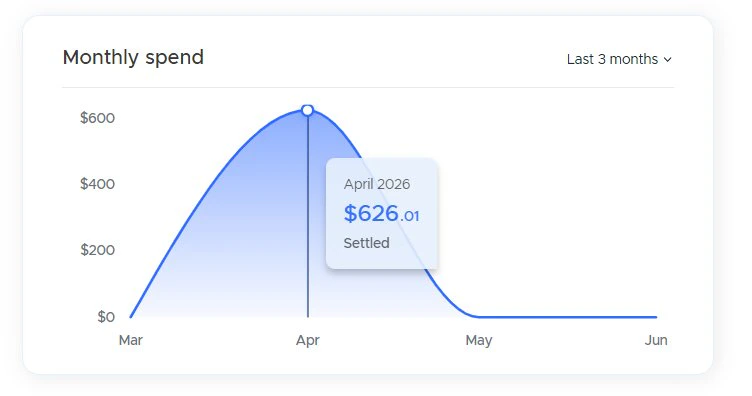
The monthly spend widget visualizes your spending over time. You can toggle between **Last 3 months** and **Last 6 months** using the range dropdown. Hover over any data point to see the exact spend amount for that period. The data in this chart refreshes hourly, so it always reflects your most recent spending activity.
### 2. Metric tiles
Below the account overview, quick-glance metric tiles summarize key financial data points:
| Metric tile | Description |
| ------------------------------------- | ----------------------------------------------------------------------------------------------------------- |
| **Pending card transactions** | Total dollar amount of transactions that haven't settled yet |
| **Pending ACH transfers** | Total dollar amount of bank transfers currently in progress |
| **Total ledger balance at 12am (ET)** | Your account's ledger balance as of midnight Eastern Time |
| **Card spend since 12am (ET)** | How much has been spent on cards since the start of the day |
| **Spend billing cycle** | Total spend in the current billing cycle (Credit programs) |
| **Credit line amount** | Your total credit line (Credit programs). Includes an action to request a credit limit increase if eligible |
### 3. Monthly spend
The monthly spend widget visualizes your spending over time. You can toggle between **Last 3 months** and **Last 6 months** using the range dropdown. Hover over any data point to see the exact spend amount for that period. The data in this chart refreshes hourly, so it always reflects your most recent spending activity.
 ### 4. Credit payments
The credit payments widget shows your most recent credit payments (up to 7). Each bar is color-coded by payment status:
* **Blue** — Settled (payment completed successfully)
* **Red** — Failed (payment was not successful)
* **Purple** — Pending (awaiting replenishment)
Hover over a bar to see the payment date, amount and status. A "View all" link takes you to the full Payments page.
This widget only appears on **Credit/Charge programs** that have payment history.
### 5. My rebates
If your account earns rebate rewards, this card displays:
* **Year-to-date** — Rebate amount earned this year
* **Lifetime earned** — Total rebates earned since account creation
## Cardholder dashboard widgets
When Cardholders log in, they see a personal spending chart on their Dashboard:
### Monthly spend (Cardholder view)
The same spend chart as the admin view, but scoped to the individual Cardholder's spending. It appears below the Cardholder's card image and balance information.
## Cards page widgets
### Credit limit usage
The credit limit usage widget shows **which Cardholders are approaching their credit limit** with a detailed list. You can filter by utilization threshold (e.g., 50%+, 75%+, 90%+) using the dropdown.
The widget shows:
* The number of Cardholders at or above the selected threshold out of the total eligible
* A clickable list of those Cardholders with their card last-4 digits and utilization percentage
* An option to **enable Early Auto Pay** if not already configured
**Tip:**
Use the credit limit usage widget to proactively manage card limits. If several Cardholders are nearing their limits, consider updating Cardholders' spend rules to prevent declines.
### Card-level decline reasons
On each card's detail page (Declines tab), a "Top decline reasons" widget shows the most common decline reasons for that specific card over a selectable time range (30 days, 3 months or 6 months).
## Transactions page widgets
### Top decline reasons (business-wide)
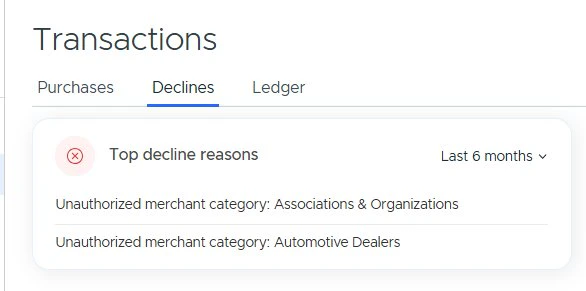
The top decline reasons widget shows a compact list of the top 5 reasons transactions are being declined across your entire business. Select from **Last 30 days**, **Last 3 months** or **Last 6 months** to adjust the date range.
This widget is displayed at the top of the **Card Declines** tab within the Transactions section.
### 4. Credit payments
The credit payments widget shows your most recent credit payments (up to 7). Each bar is color-coded by payment status:
* **Blue** — Settled (payment completed successfully)
* **Red** — Failed (payment was not successful)
* **Purple** — Pending (awaiting replenishment)
Hover over a bar to see the payment date, amount and status. A "View all" link takes you to the full Payments page.
This widget only appears on **Credit/Charge programs** that have payment history.
### 5. My rebates
If your account earns rebate rewards, this card displays:
* **Year-to-date** — Rebate amount earned this year
* **Lifetime earned** — Total rebates earned since account creation
## Cardholder dashboard widgets
When Cardholders log in, they see a personal spending chart on their Dashboard:
### Monthly spend (Cardholder view)
The same spend chart as the admin view, but scoped to the individual Cardholder's spending. It appears below the Cardholder's card image and balance information.
## Cards page widgets
### Credit limit usage
The credit limit usage widget shows **which Cardholders are approaching their credit limit** with a detailed list. You can filter by utilization threshold (e.g., 50%+, 75%+, 90%+) using the dropdown.
The widget shows:
* The number of Cardholders at or above the selected threshold out of the total eligible
* A clickable list of those Cardholders with their card last-4 digits and utilization percentage
* An option to **enable Early Auto Pay** if not already configured
**Tip:**
Use the credit limit usage widget to proactively manage card limits. If several Cardholders are nearing their limits, consider updating Cardholders' spend rules to prevent declines.
### Card-level decline reasons
On each card's detail page (Declines tab), a "Top decline reasons" widget shows the most common decline reasons for that specific card over a selectable time range (30 days, 3 months or 6 months).
## Transactions page widgets
### Top decline reasons (business-wide)
The top decline reasons widget shows a compact list of the top 5 reasons transactions are being declined across your entire business. Select from **Last 30 days**, **Last 3 months** or **Last 6 months** to adjust the date range.
This widget is displayed at the top of the **Card Declines** tab within the Transactions section.
 **Note:**
Understanding decline reasons helps you take corrective action — such as adjusting spend policies, increasing card limits or enabling additional merchant categories — to keep your team productive.
### Cardholder purchases overview
When viewing an individual Cardholder's Purchases tab, a collapsible **Overview** panel shows that Cardholder's personal spend chart with a range selector (Last 3 months / Last 6 months).
## Team members page widget
### Registered users
The registered users widget breaks down your registered users into **Cardholders** and **Admins**, with the total count displayed in the center. The legend shows the count for each role.
**Note:**
Understanding decline reasons helps you take corrective action — such as adjusting spend policies, increasing card limits or enabling additional merchant categories — to keep your team productive.
### Cardholder purchases overview
When viewing an individual Cardholder's Purchases tab, a collapsible **Overview** panel shows that Cardholder's personal spend chart with a range selector (Last 3 months / Last 6 months).
## Team members page widget
### Registered users
The registered users widget breaks down your registered users into **Cardholders** and **Admins**, with the total count displayed in the center. The legend shows the count for each role.
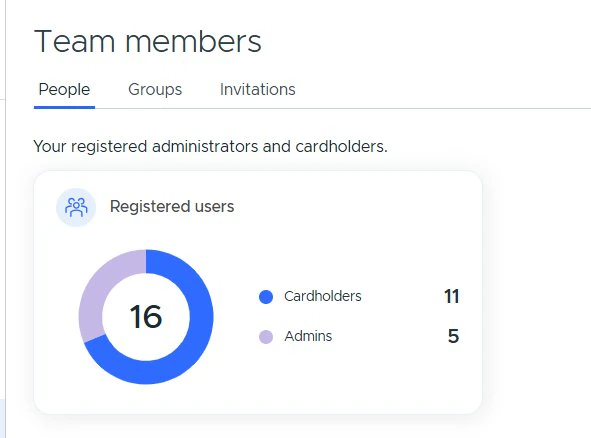 This widget appears at the top of the **Team Members** page and provides an at-a-glance view of your team composition.
## Availability
If you do not see these widgets, the feature may not yet be enabled for your account. Contact your PEX account manager or [PEX Support](https://www.pexcard.com/contact-us/) to inquire about enabling Dashboard analytics for your business.
**Note:**
Some widgets are specific to Credit/Charge expense programs (e.g., credit payments, credit limit usage). Prepaid program administrators will see the prepaid-specific metric tiles and spend chart instead.
This widget appears at the top of the **Team Members** page and provides an at-a-glance view of your team composition.
## Availability
If you do not see these widgets, the feature may not yet be enabled for your account. Contact your PEX account manager or [PEX Support](https://www.pexcard.com/contact-us/) to inquire about enabling Dashboard analytics for your business.
**Note:**
Some widgets are specific to Credit/Charge expense programs (e.g., credit payments, credit limit usage). Prepaid program administrators will see the prepaid-specific metric tiles and spend chart instead.